| hermann on Tue, 28 Nov 2023 15:37:11 +0100 |
[Date Prev] [Date Next] [Thread Prev] [Thread Next] [Date Index] [Thread Index]
| Re: Questions on plotting hyperellratpoints() |
On 2023-11-27 23:48, Bill Allombert wrote:
plotinit(1);
for(i=1,#X,plotmove(1,X[i],Y[i]);plotrbox(1,2,2,1));
plotrecth(1,x=-2,2,x^2);
plotdraw(1);

I join the result.

Cheers,
Bill
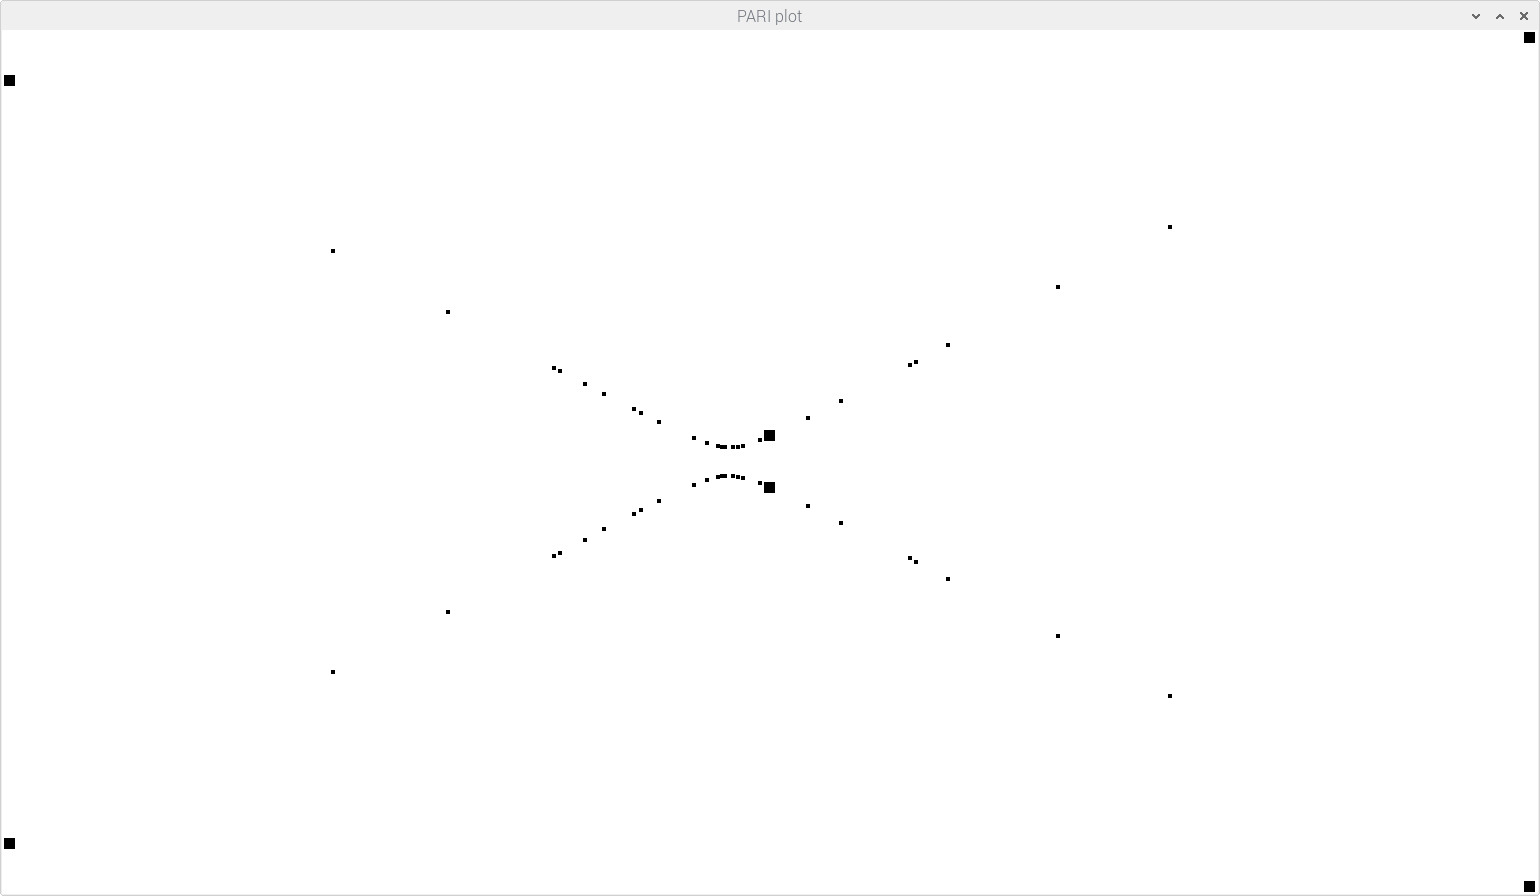
Thanks Bill for that example.I learned from you on "hyperellratpoints()" and wanted to get visual insight into its results. Especially interested I am into the pairs [z,w] with integer w, those are drawn as big dots.
Attached screenshot shows window for executing this:

pi@raspberrypi400:~ $ e="353*z^2 + 188*z + 36" h="40" gp -q < plt.3.gp
[[-5, 89], [-5, -89], [0, 6], [0, -6], [5, 99], [5, -99]]
-5 5 -99 99
pi@raspberrypi400:~ $
Yesterday I had to do drawing on AMD Ubuntu PC, because 7x13 font was missing on my Pi400. Got help on which font package to install, now works on Raspberry Pi400 as well:
https://forums.raspberrypi.com/viewtopic.php?t=360459


The foreach assert in line 5 verifies all hyperellratpoints property.
And the big dots for integer w are those of interest to me (for Kunerth algorithm).
$ cat plt.3.gp
assert(b,s)=if(!(b), error(Str(s)));
h=eval(getenv("h"));
e=eval(getenv("e"));
H=hyperellratpoints(e,h);
foreach(H,R,assert(subst(e,z,R[1])==R[2]^2));

print([R|R<-H,type(R[2])=="t_INT"]);
X=[R[1]|R<-H];
Y=[R[2]|R<-H];
Xi=[R[1]|R<-H,type(R[2])=="t_INT"];
Yi=[R[2]|R<-H,type(R[2])=="t_INT"];

print(vecmin(X)," ",vecmax(X)," ",vecmin(Y)," ",vecmax(Y));
dx=(vecmax(X)-vecmin(X))/400;
dy=(vecmax(Y)-vecmin(Y))/240;

plotinit(1);
plotscale(1,vecmin(X)-2*dx,vecmax(X)+2*dx,vecmin(Y)-2*dy,vecmax(Y)+2*dy);
for(i=1,#X,plotmove(1,X[i]-dx/2,Y[i]-dy/2);plotrbox(1,dx,dy,1));
for(i=1,#Xi,plotmove(1,Xi[i]-3*dx/2,Yi[i]-3*dy/2);plotrbox(1,3*dx,3*dy,1));
plotdraw(1);
$

Regards,

Hermann.
Attachment:
hyperellratpoints.jpg
Description: JPEG image